
- Historical patterns suggest XRP could be repeating previous bullish trends, with key Fibonacci levels acting as support.
- RSI remains neutral at 56.54, while MACD shows weak bullish pressure, indicating market indecision showing mixed reactions.
- XRP must hold above $2.71 to aim for $3+, but rejection could trigger retracement towards $1.50-$1.80.
The cryptocurrency market continues to experience fluctuations, but XRP holders remain optimistic about the asset’s long-term potential. Recent market data suggests an upward trajectory, with historical price patterns indicating that XRP could be entering a significant growth phase.
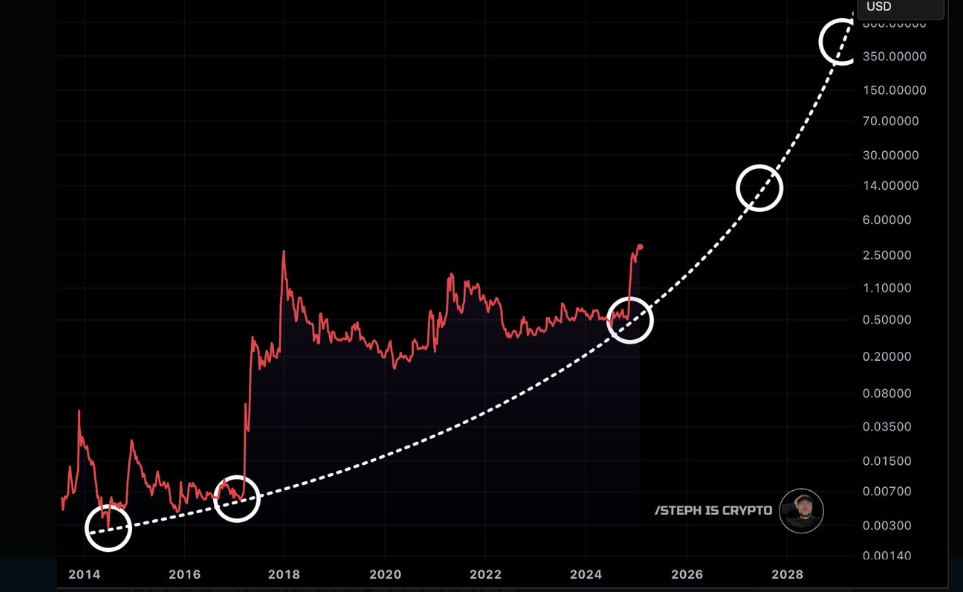
This newest chart indicates XRP price movements lined up with previous upward trends because prices skyrocketed at essential support areas. Price surges from 2017 and 2020 produced notable growth that makes experts wonder if the present market cycle will replicate similar patterns.
XRP’s Wick Pattern Crashes,Recoveries and Market Behavior
According to analyst JD,he emphasized calling the 50% wick XRP crash drop. In his chart analysis the descending triangle pattern shows 2018 highs (~$3.30) to a breakout in 2024. Price consolidated between $0.28 – $0.60 before breaking out sharply with Fibonacci retracement levels at 0.618 level at $0.44648 (previous resistance) and 0.786 level at ~$0.28517 (strong support in past cycles).
The RSI shows hidden bullish divergence, indicating strong continuation potential. Thus, if XRP holds above $2.71, momentum could push it towards $3+, possibly retesting all-time highs ($3.30-$3.80). While ,a rejection near $2.71 – $3 could trigger a retracement to the $1.50 – $1.80 range or a retest of $0.618 Fibonacci ($0.44). XRP’s Wick declines in the past have frequently acted as springboards for powerful price surges.
Current Market Dynamics and Key Technical Signals.
At press time,XRP was trading at $2.49 with a price surge of 1.94% and the trading volume at $21.14 B showing a positive sentiment among XRP investors.
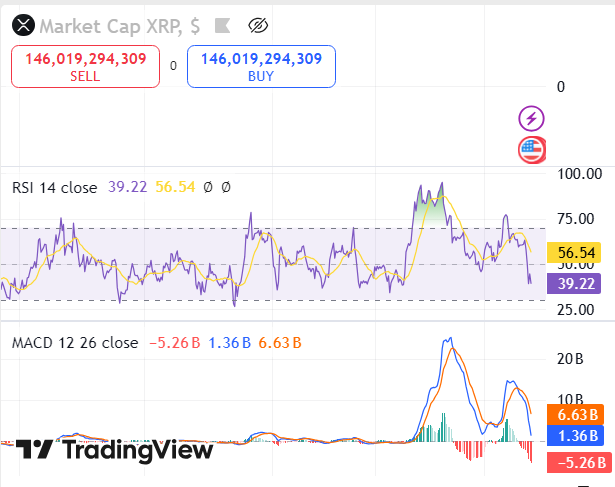
The Relative Strength Index (RSI) is at 56.54, indicating the market is in a neutral condition. This level often signals a potential balance between bullish and bearish positions. The MACD line is trading below the signal line indicating negative momentum with weak bullish pressure. Moreover, the histogram shows minimal divergence between the MACD and signal lines with bears in the market. XRP’s price action suggests potential growth, but key resistance remains critical.


