
- SHIB trades at $0.00001602, down 1.97% in 24 hours, with a 33.41% monthly drop, testing support at $0.00001560-$0.00001600.
- RSI at 34.25 suggests oversold conditions, while shrinking MACD histogram indicates weakening selling pressure and possible reversal.
- Burn rate dropped 85.88% in 24 hours, but weekly burns surged 2,395.82%, reducing supply and potentially supporting price stability.
Shiba Inu (SHIB) has struggled to regain momentum since hitting its cycle high in March 2024. The second most popular meme coin had a 34% decline, and it trades near critical support levels. On February 6th, at press time, SHIB was trading at $0.00001602, a 1.97% drop in the last 24 hours. Over the past month, it has fallen by 33.41%.
SHIB Price and Technical Indicators
SHIB’s price has formed a support between $0.00001560 and $0.00001600. Despite the recent decline, the market is showing signs of potential accumulation. Price moves suggest increased buying interest at lower levels.
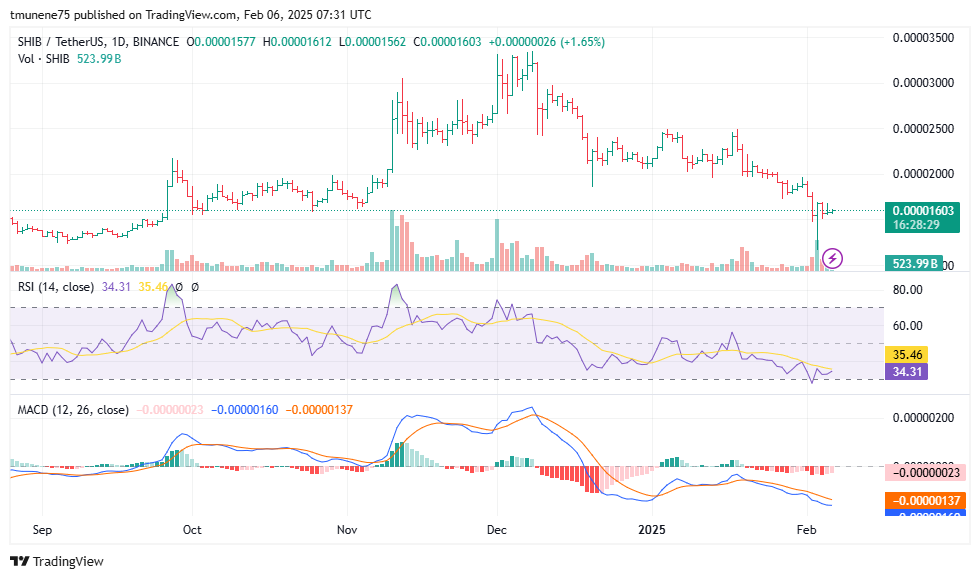
Today’s candle has a small body and a lower wick, indicating that traders are stepping in to buy the dip. The RSI is at 34.25, near the oversold region. If it moves above 40, bullish momentum could increase.
Meanwhile, the MACD remains bearish, with the MACD line at -0.00000160, still below the signal line. However, the shrinking histogram bars suggest that selling pressure is weakening. A bullish crossover in the MACD could confirm a reversal.
Support and Resistance Levels
If buying pressure increases, SHIB could attempt a recovery above $0.00001650. Breaking this level may lead to a rally toward $0.00001800, with further resistance at $0.00002000 and $0.00002200.
However, if sellers dominate, SHIB could slip below $0.00001560, leading to support at $0.00001450. A stronger decline might push the price toward $0.00001300. Exchange flow data shows notable withdrawal activity.
Over the past 24 hours, 2,648,917 SHIB tokens have been burned, a 85.88% decrease from the previous period. The past week saw a 2,395.82% surge in burn volume, indicating a shift in supply. A continued reduction in circulating supply may influence SHIB’s price stability.
Market Trends and Institutional News
Increased net outflows from exchanges suggest ongoing accumulation by long term holders. SHIB had a substantial sell off in November, followed by increased inflows in December.
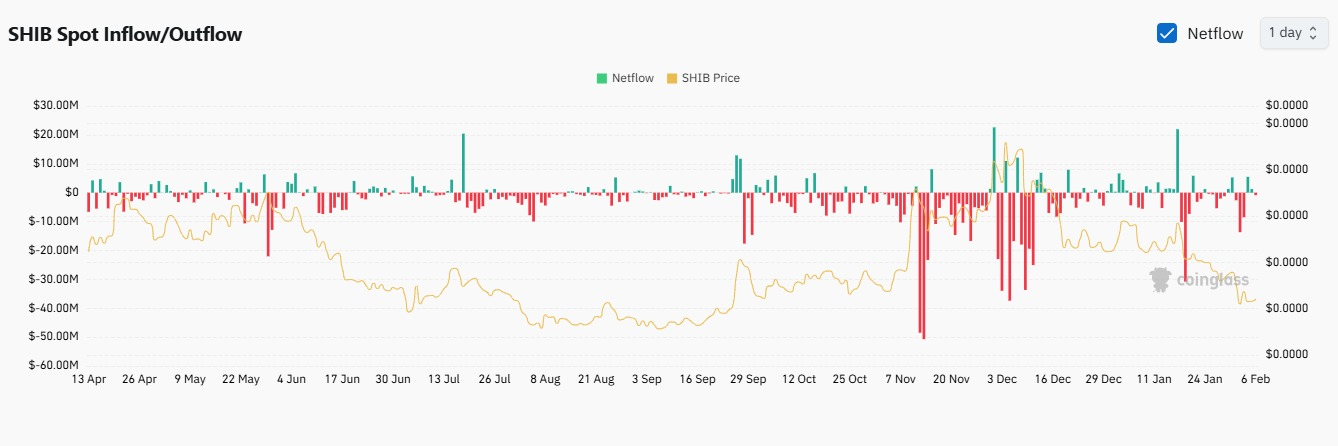
Coinglass data indicates a mix of outflows and moderate inflows, suggesting some profit taking activities. If outflows remain dominant, selling pressure may ease, supporting a short term price rebound.
Meanwhile, Shiba Inu has partnered with the UAE’s Ministry of Energy and Infrastructure to integrate Web3 solutions into governance and infrastructure. This collaboration involves ShibOS technology, aiming to improve citizen focused services and green infrastructure.
For February 7, SHIB’s movement will depend on market sentiment and liquidity trends. A break above $0.00001650 could push the price toward $0.00001800, while increased selling pressure might lead to a decline toward $0.00001450.


