
- SHIB trades at $0.00001585, down by 2.71% in 24 hours but up 9.76% weekly, with key support at $0.00001390 and resistance at $0.00001755.
- Burn rate surged 807.68% in 24 hours, yet the 7 day burn volume dropped 94.6%, indicating fluctuating supply reduction impact.
- A falling wedge pattern signals a potential breakout, with a bullish target of $0.00004401 by May 2025 if momentum strengthens.
Shiba Inu (SHIB) had a 2.71% decline in the last 24 hours, trading at $0.00001585 at press time. Despite this, SHIB has gained 9.76% over the past week, though it remains 26.24% lower over the last month.
According to Shibburn, SHIB’s market cap is at $9.35 billion, a 2.66% drop. The past 24 hours had 20,530,875 tokens burned, an 807.68% increase, while the seven day burn volume reached 62,766,791 tokens, a sharp 94.6% decline.
Price Movement and Key Support Levels
On a daily timeframe, SHIB has been fluctuating between $0.00001528 and $0.00001567. Over recent months, SHIB surged near $0.00003500 before entering a downtrend.
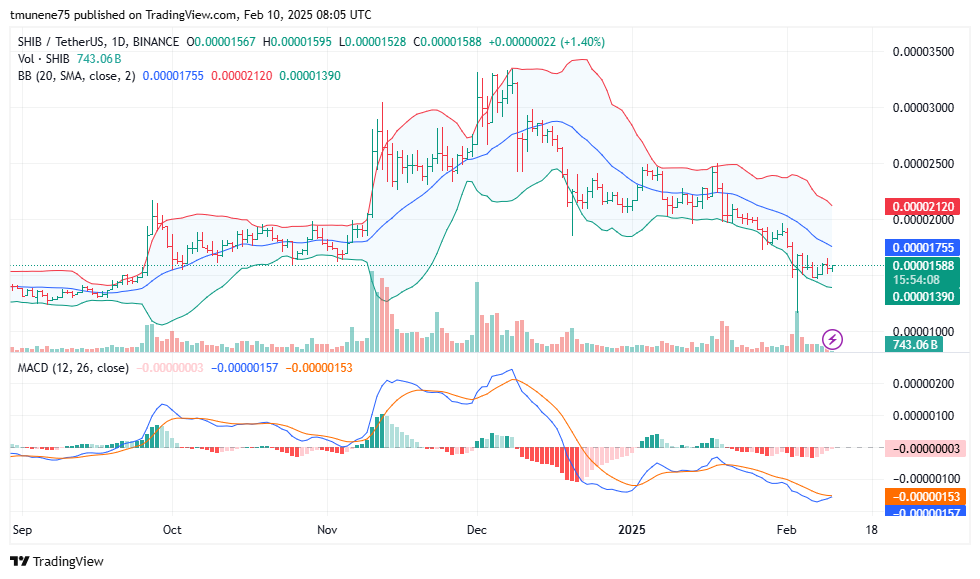
Support levels are at $0.00001390, while resistance is at $0.00001755 and $0.00002120. If the price sustains above support, an upward push toward resistance could be expected. The Bollinger Bands indicate a moderate squeeze, suggesting upcoming volatility.
The upper band at $0.00002120 represents resistance, while the lower band at $0.00001390 acts as strong support. The middle band at $0.00001755 the dynamic support and resistance zone, influencing SHIB’s movement.
Momentum Indicators and Potential Reversal
The MACD line is at -0.00000157, slightly below the signal line at -0.00000153. While the MACD histogram suggests minor bullish divergence, a clear crossover is needed for confirmation of a trend reversal.
Previous bearish pressure has weighed on SHIB, but a shift in momentum could indicate potential recovery. If SHIB surpasses the $0.00001755 resistance level, it may test the next target at $0.00002120, potentially leading to a continued upward trend.
However, falling below $0.00001390 could push SHIB lower, possibly toward $0.00001000. The Bollinger Band squeeze implies that the asset might consolidate before a decisive breakout.
Long Term Outlook and Resistance Levels
According to analyst Rose, SHIB is up for a reversal. The market pattern suggests a falling wedge pattern, which could lead to a breakout. The key support level is at $0.00001259, an area where buyers have previously stepped in.
Resistance targets include $0.00002913, $0.00003612, and $0.00004401. The current market pattern indicates two possible outcomes. If SHIB holds above support, a breakout toward $0.00002913 or higher is possible.
However, failure to maintain support could push the price lower. The prediction suggests a potential 251.21% rally to $0.00004401 by May 2025 if bullish momentum strengthens. On the downside, a drop to $0.00001259 remains a risk if selling pressure increases.


