- SHIB’s falling wedge suggests a potential breakout, with resistance at $0.00002913, $0.00003612, and $0.00004401 if momentum builds.
- Volume surged in February to March but has since declined, suggesting an accumulation phase before a possible upward move.
- SHIB trades at $0.00001601, down 1.51% daily but up 9.76% weekly; support at $0.00001259 is crucial for a bullish reversal.
Shiba Inu (SHIB) is nearing a breakout, with analyst Rose predicting a potential bullish reversal. According to the analyst, SHIB is forming a falling wedge pattern, a pattern that historically suggests a breakout.
The price has retested an important accumulation zone and could target $0.00002913, $0.00003612, and $0.00004401 if momentum shifts upward. However, maintaining support near $0.00001259 is crucial.
Key Levels and Market Outlook
SHIB’s price has been trending downward, having a support level at $0.00001259. This level has previously been a strong demand zone, preventing further declines.
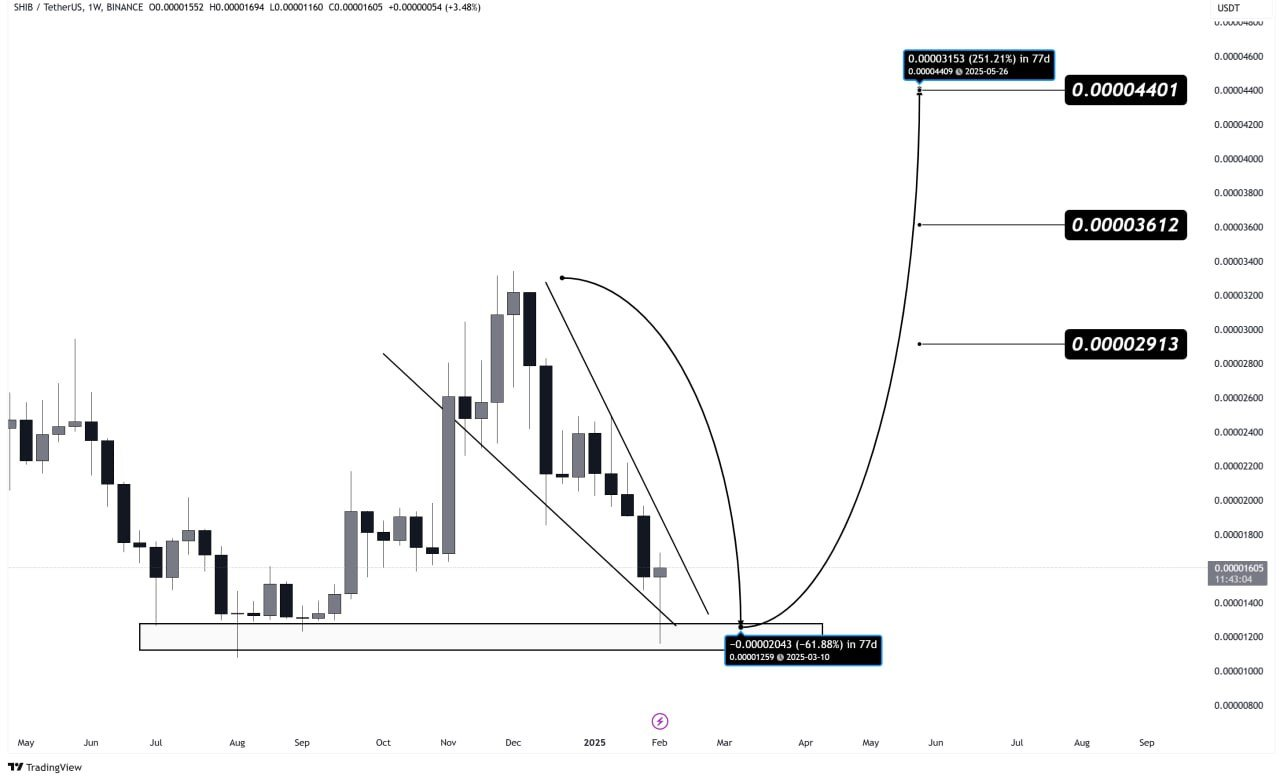
If buyers step in, resistance levels at $0.00002913, $0.00003612, and $0.00004401 could become the next upside targets. The price has formed lower highs and lower lows, indicating compression within the falling wedge.
A breakout above the pattern could push SHIB’s price upward, aligning with historical movements. A failure to hold support might result in a decline, but past trends suggest that rebounds from this zone have been frequent. SHIB remains in a crucial phase where either outcome is possible.
Market Trends and Volume
SHIB’s trading volume has fluctuated substantially over the past year, indicating shifts in market sentiment. Between April and January, trading activity remained low, with only minor spikes in mid June and early August.
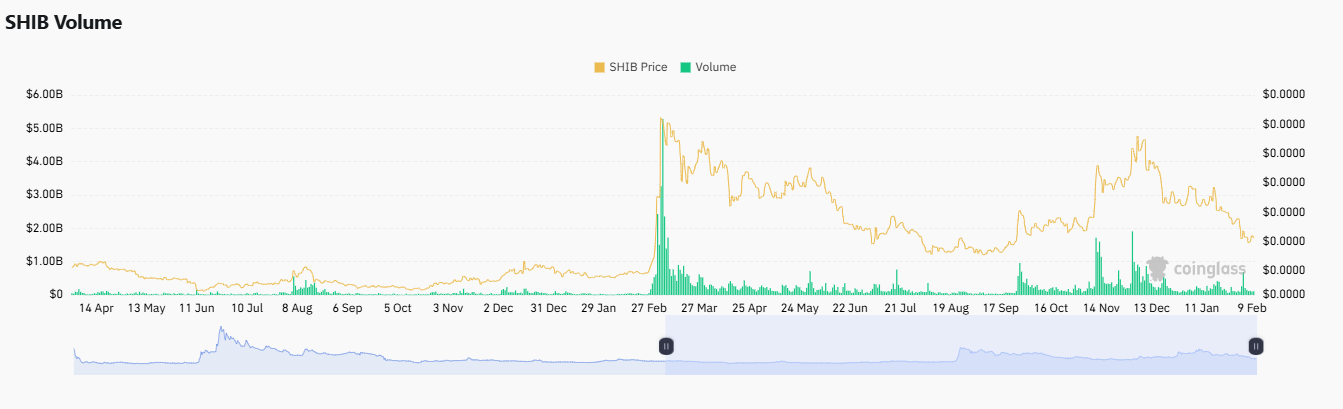
However, a sharp increase in volume between February and March coincided with a major price surge, indicating strong buying interest at that time. Following this peak, a gradual downtrend set in, accompanied by declining volume.
Despite occasional price rebounds, the overall market activity weakened, suggesting reduced investor activity. A secondary rally in mid November had moderate volume growth, though it was lower than the February March period.
This movement hinted at short term speculation rather than sustained bullish momentum. Recent trends indicate a continued decline in both price and volume, suggesting a potential accumulation phase.
If SHIB revisits key support levels with increased volume, a stronger move could follow. However, without renewed buying interest, further price consolidation may occur before a decisive breakout.
Market Performance and Outlook
On February 10, SHIB was trading at $0.00001601, a 1.51% drop in the past 24 hours. Despite this, the token has gained 9.76% over the last seven days but remains down 27.07% over the past month with market sentiment remaining cautious.
Shiba Inu’s official X page noted the need for higher volume and increased market confidence, emphasizing that broader market conditions could influence SHIB’s next move.
The Fear and Greed Index is an important indicator to assess whether investors are prepared for a sustained upward push. If volume surges, SHIB could attempt another breakout, while continued stagnation might prolong consolidation.


