
- FET shows bullish momentum with potential breakout above $1.30 resistance level.
- Support levels at $1.14 and $1.20 crucial for maintaining upward price trend.
- RSI below 50 indicates neutral momentum, signaling possible future volatility.
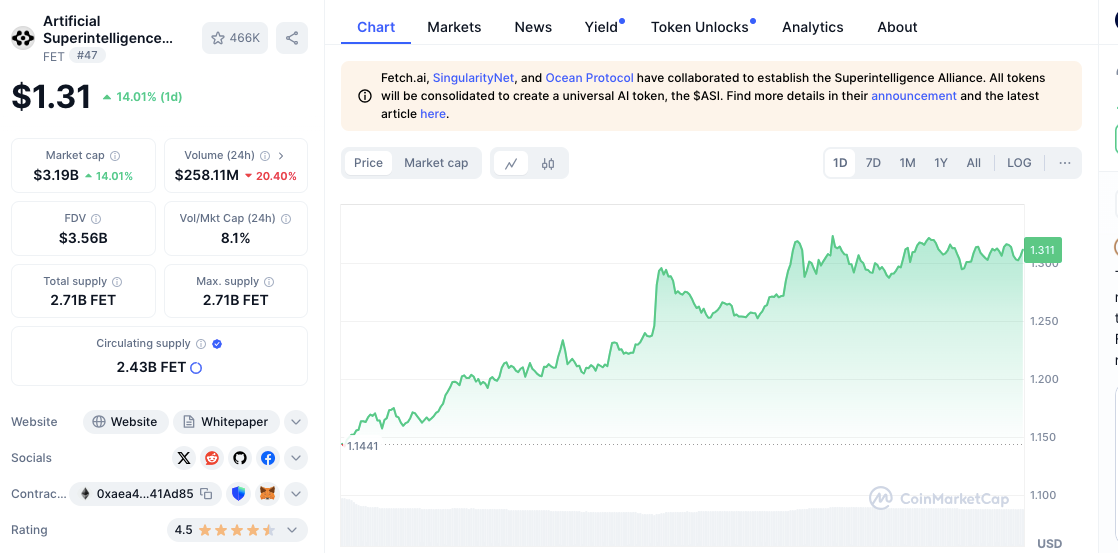
Artificial Superintelligence (FET) has made a notable move recently, reaching $1.30 and showing a 13.97% increase in the past 24 hours. As the price continues to climb, many are wondering whether FET is gearing up for a significant rally.
Current Price Trend and Momentum
The price of Fetch.ai has been in a steady uptrend, with clear signs of bullish momentum. The recent price surge to $1.30 represents a peak reached after a series of higher highs and higher lows.
This suggests the market sentiment is positive and that FET is gaining traction among investors. The price has been consolidating around the $1.30 mark, which could signal that the market is preparing for a potential breakout or pullback.
Support Levels to Watch
The most immediate support level for FET is around $1.14, where the price briefly dipped earlier in the day. This could act as a strong short-term support, helping the price to maintain its upward trend.
Additionally, $1.20 is another important level to monitor, as the price had previously consolidated around this area before continuing its rise. If the price fails to hold these levels, the next potential support could be around $1.10, a psychological level that could trigger buying interest.
Resistance Levels and Potential Upside
On the resistance side, $1.30 represents the current peak and immediate hurdle for the price. Should FET break above this level, the next significant resistance is likely to be around $1.35, based on recent price behavior and the bullish trend.
If this level is surpassed, the price could continue its upward movement toward $1.40, where selling pressure may increase. This level is seen as a crucial zone for FET’s price action, and a breakout above it could indicate sustained bullish momentum.
Technical Indicators: RSI and MACD
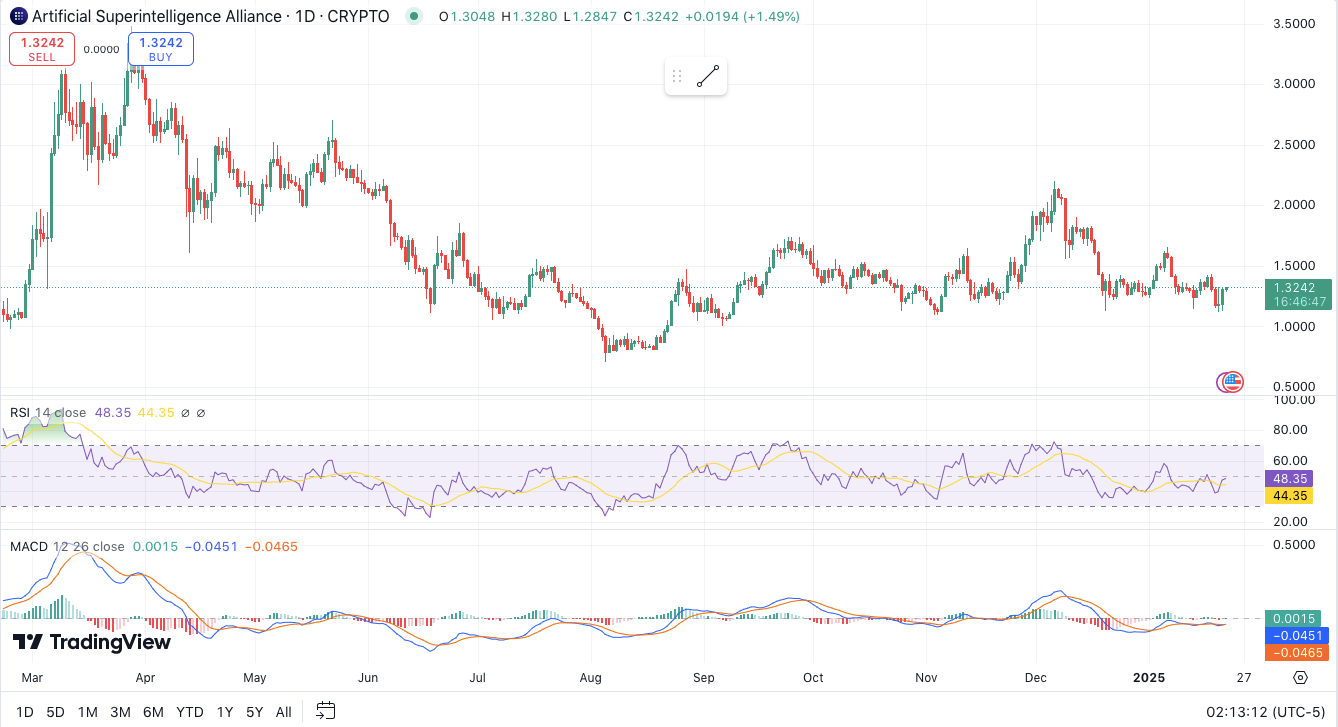
At press time, the Relative Strength Index (RSI) stands at 47.09, indicating neutral momentum. Since it is below the 50 level, this suggests that the market is neither overly bullish nor bearish. A move above 50 could signal growing bullish strength, while a decline below 40 could point to further downside risk.
Meanwhile, the Moving Average Convergence Divergence (MACD) shows weak momentum. The MACD lines are near the zero level, indicating a lack of clear trend dominance.
However, a bullish crossover above zero could signal the beginning of a more sustained upward move, while a bearish divergence could indicate that the upward momentum is losing steam.
Looking Ahead to 2025: Price Prediction
As per gate.io analysis, for 2025 the price of Fetch.ai is projected to stabilize with an average price of $1.30. However, the price could fluctuate, with highs reaching up to $1.49 and lows potentially falling to $1.19.


