
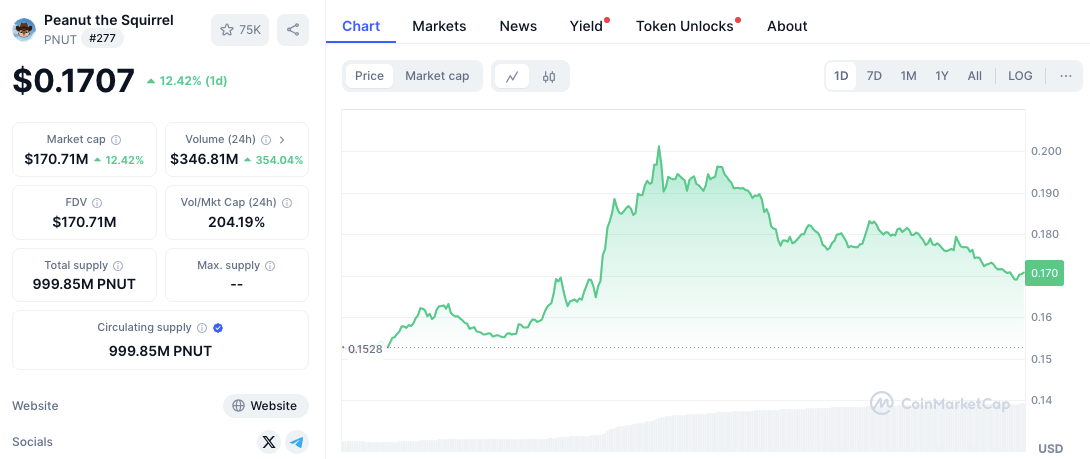
- PNUT’s 10.56% surge and 352.71% volume spike signal strong market activity.
- Resistance at $0.200-$0.205 could limit gains, while $0.165 support is crucial.
- RSI at 32.28 hints at reduced selling pressure, boosting chances of a rebound.
Peanut the Squirrel (PNUT) has shown significant movement in the last 24 hours, rising by 10.56% to trade at $0.1690. This increase signals heightened market activity, with a sharp surge in trading volume of 352.71%. The price recently peaked above $0.200 before facing resistance, followed by a correction that brought it back to current levels.
Current Market Trend
PNUT’s price action indicates strong bullish momentum, but resistance levels have slowed its climb. After breaking past $0.200, the token retraced, stabilizing near $0.1690.
The high trading volume suggests continued interest, which could influence the next price movement. If the buying pressure sustains, PNUT may attempt another breakout in the coming sessions.
Support and Resistance Levels to Watch
The price is currently testing critical levels that will determine its short-term direction. Resistance remains strong between $0.200 and $0.205, where the previous uptrend faced rejection.
If PNUT surpasses this level, further gains could follow. Another resistance zone exists between $0.190 and $0.195, an area where the price briefly consolidated before declining.
On the downside, immediate support lies between $0.165 and $0.170, a range that has held steady during recent pullbacks. A break below this zone could push PNUT toward its next major support between $0.152 and $0.155. These levels previously marked the lowest points in the recent price cycle, making them crucial for maintaining market stability.
Technical Indicators and Market Outlook
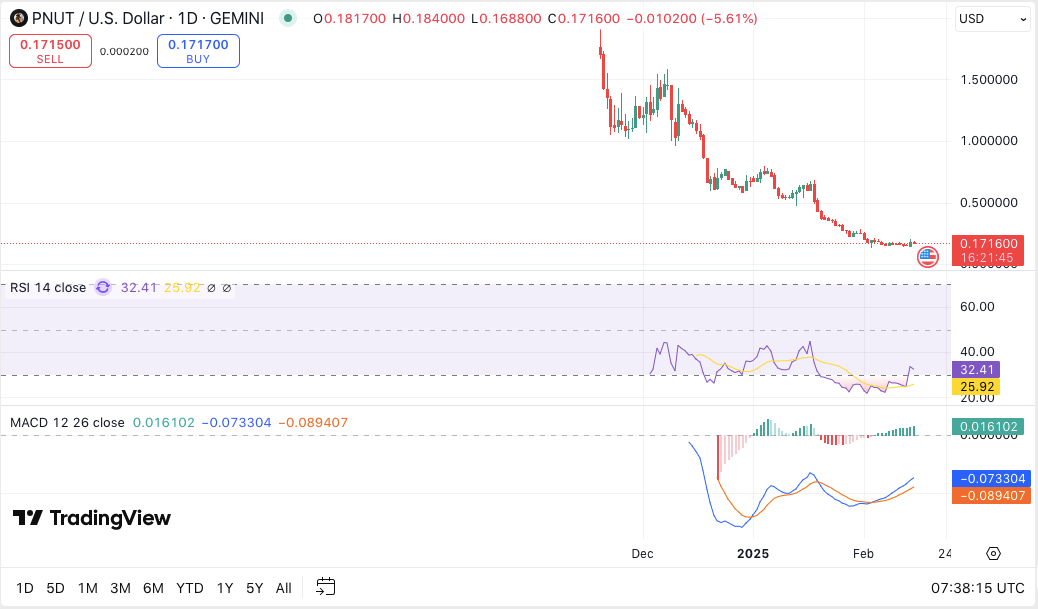
Technical indicators suggest a potential shift in momentum. The Relative Strength Index (RSI) stands at 32.28, approaching the oversold threshold of 30. This signals that selling pressure is easing, increasing the likelihood of a rebound. If RSI moves above 40, it could confirm renewed bullish momentum.
Additionally, the MACD indicator is showing signs of a possible trend reversal. The MACD line, currently at -0.0734, remains below the signal line but is moving upward. If a crossover occurs, it may indicate a shift in trend. Moreover, the histogram turning green suggests that bearish momentum is weakening, supporting a possible price recovery.


