
- Dogecoin may dip to $0.19–$0.20 before a potential upward rally begins.
- A breakout above $0.280 could signal a shift toward higher resistance at $0.320.
- DOGE’s RSI nearing oversold levels indicates a possible price reversal on the horizon.
Dogecoin (DOGE) is showing signs of a possible rebound after a period of consolidation. The meme-based cryptocurrency is currently trading at $0.25301, marking a 1.61% increase.
Despite experiencing a 2.09% decline in the past 24 hours, DOGE has gained 2.40% over the last week. Analysts suggest that the price action is approaching a crucial juncture, with key support and resistance levels influencing its next move.
Market Indicators and Key Levels
Cas Abbé, a market analyst, points to a rounding bottom pattern that could signal an upward trend. Additionally, the weekly Relative Strength Index (RSI) is nearing its support trendline, suggesting a potential price reversal. Abbé anticipates one final dip toward the $0.19-$0.20 range before a strong upward surge.
Meanwhile, analyst Ali Martinez highlights a significant liquidity shift if DOGE climbs to $0.276. He notes that such a move could impact over $94 million in open positions, potentially driving increased volatility. Given these factors, traders are closely watching how DOGE reacts to key support and resistance levels.
Currently, Dogecoin is stabilizing near $0.240, which serves as an immediate support level. A more substantial support lies at $0.220, where previous accumulation occurred. Additionally, the $0.200 mark is a psychological barrier that has historically prevented further declines.
On the upside, DOGE faces resistance at $0.280, a level where recent rallies encountered selling pressure. Beyond that, $0.320 represents a significant resistance point, followed by $0.350, which aligns with a previous lower high in its downtrend. A breakout above these levels could shift market sentiment in favor of buyers.
Technical Indicators Signal Mixed Sentiment
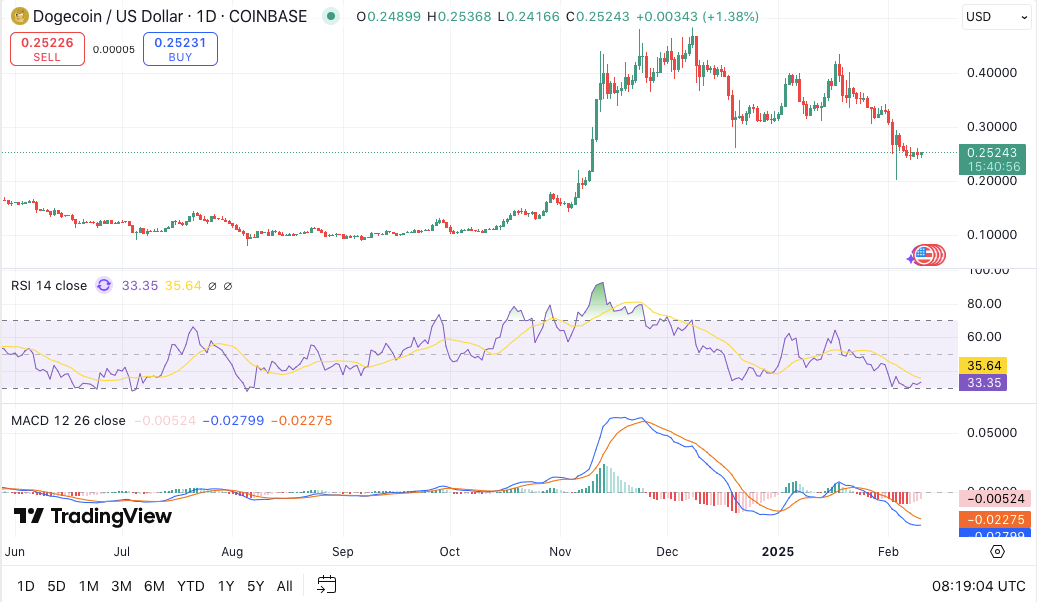
The RSI stands at 33.22, indicating bearish momentum and approaching oversold territory. The RSI moving average at 35.66 suggests weak buying pressure, though a reversal could occur if oversold conditions intensify.
The Moving Average Convergence Divergence (MACD) indicator further supports this outlook. The MACD line remains below the signal line at -0.02274, confirming ongoing bearish sentiment. However, a declining bearish histogram suggests that selling pressure may be weakening. If momentum builds, a bullish crossover could follow.
Market Trends and Outlook
Spot inflows and outflows reflect DOGE’s fluctuating activity. Between April and October, the market saw minimal movements, but mid-October marked a shift as inflows exceeded $200 million. This surge pushed prices toward $0.50.
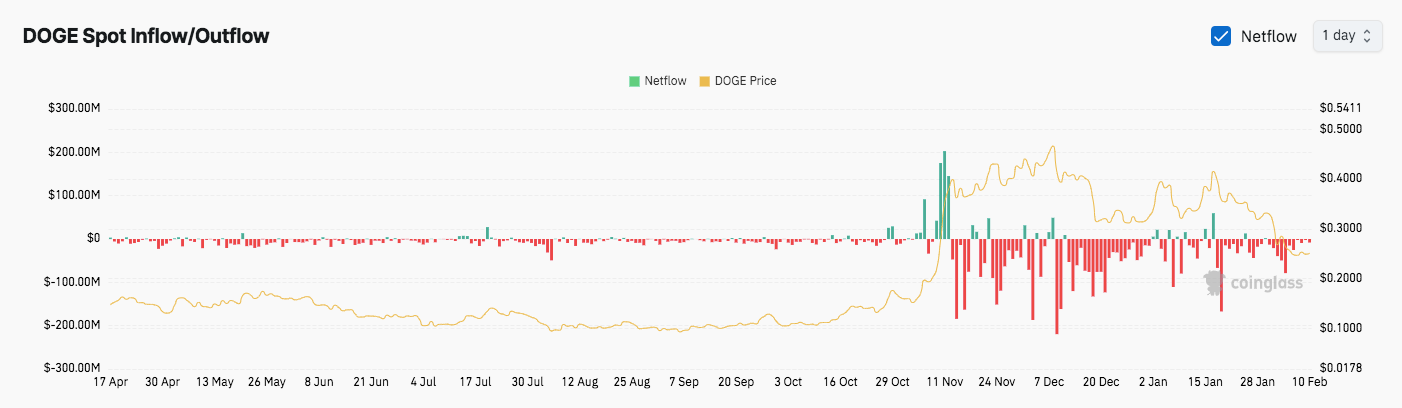
However, profit-taking in November led to significant outflows, with several exceeding $200 million. From December to February, consistent outflows aligned with price corrections toward $0.20, while intermittent inflows hinted at accumulation phases.


