- Whale transactions and active addresses surge, signaling strong investor engagement.
- Large whale sell-offs raise concerns about LINK’s short-term price stability.
- Technical indicators show bearish momentum but hint at a potential trend reversal.
The cryptocurrency market is experiencing renewed volatility, yet Chainlink (LINK) has emerged as a standout asset with significant whale accumulation. On-chain data highlights a surge in large transactions and active wallet addresses, indicating strong engagement from key stakeholders. However, price movement remains uncertain, as whale sell-offs and technical indicators suggest mixed signals regarding LINK’s short-term direction.
Whale Transactions and Active Addresses Hit Multi-Month Highs
According to Santiment, a top analytics firm, Chainlink witnessed 1,659 whale transactions exceeding $100,000 on February 3, 2025. This marks the highest count since December 6, 2023, reflecting heightened activity among major investors.
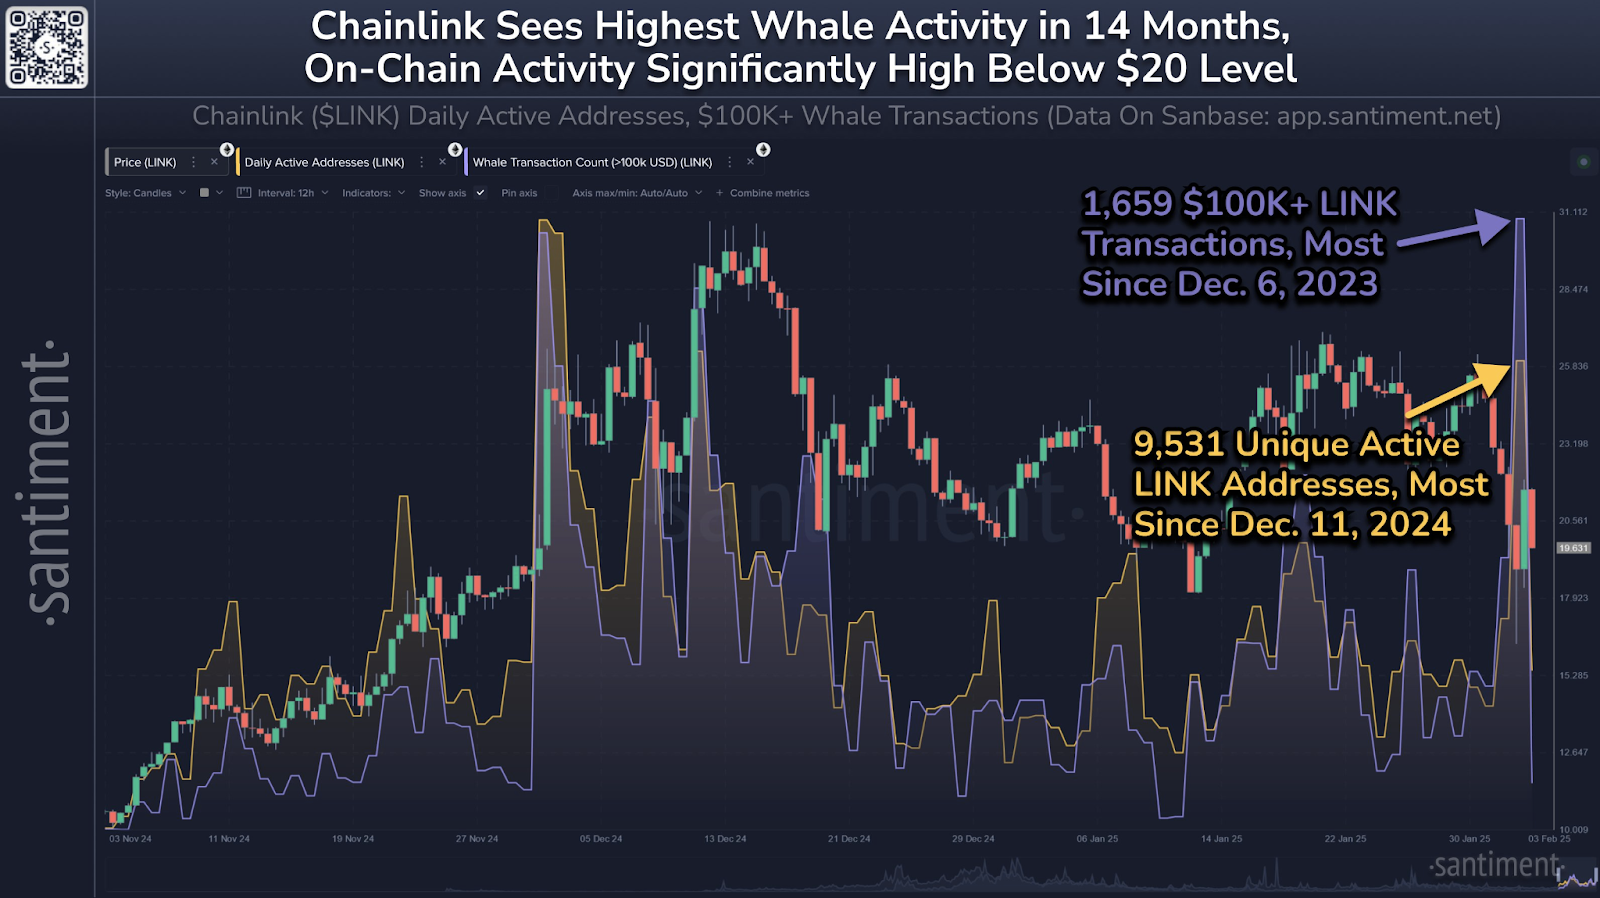
Additionally, active wallet addresses surged to 9,531 on the same day, the highest level since December 11, 2024. This increase in network engagement suggests growing investor interest, even as the broader market trends downward.
Despite these developments, LINK’s price remains below $20, trading at $19.76 with a 24-hour trading volume of $801.38 million. The asset has declined 3.91% in the past 24 hours, highlighting persistent market uncertainty. While whale activity often signals potential price movements, additional factors are influencing market sentiment.
Whale Liquidations and Bearish Momentum Raise Caution
Ali Martinez, a well-known on-chain analyst, reported that whales holding between 1 million and 10 million LINK tokens reduced their positions by 4.13 million starting February 2, 2025.
Such large sell-offs often indicate a lack of confidence in short-term gains, contributing to bearish sentiment. This trend mirrors recent liquidations that previously triggered sharp declines, making traders cautious about LINK’s near-term prospects.
If whale distributions continue, LINK may struggle to maintain its current price range. However, increased accumulation by other market participants could counteract these effects, potentially stabilizing the asset. The balance between buying and selling pressure will determine whether LINK can recover or extend its losses further.
Technical Indicators Signal Potential Trend Reversal
Nebraskangooner, a respected crypto trader, noted that LINK is currently in a consolidation phase. He warned that a breakdown below key support levels could push the price as low as $12.00. Conversely, a breakout above resistance could ignite a bullish reversal, propelling LINK to new highs.
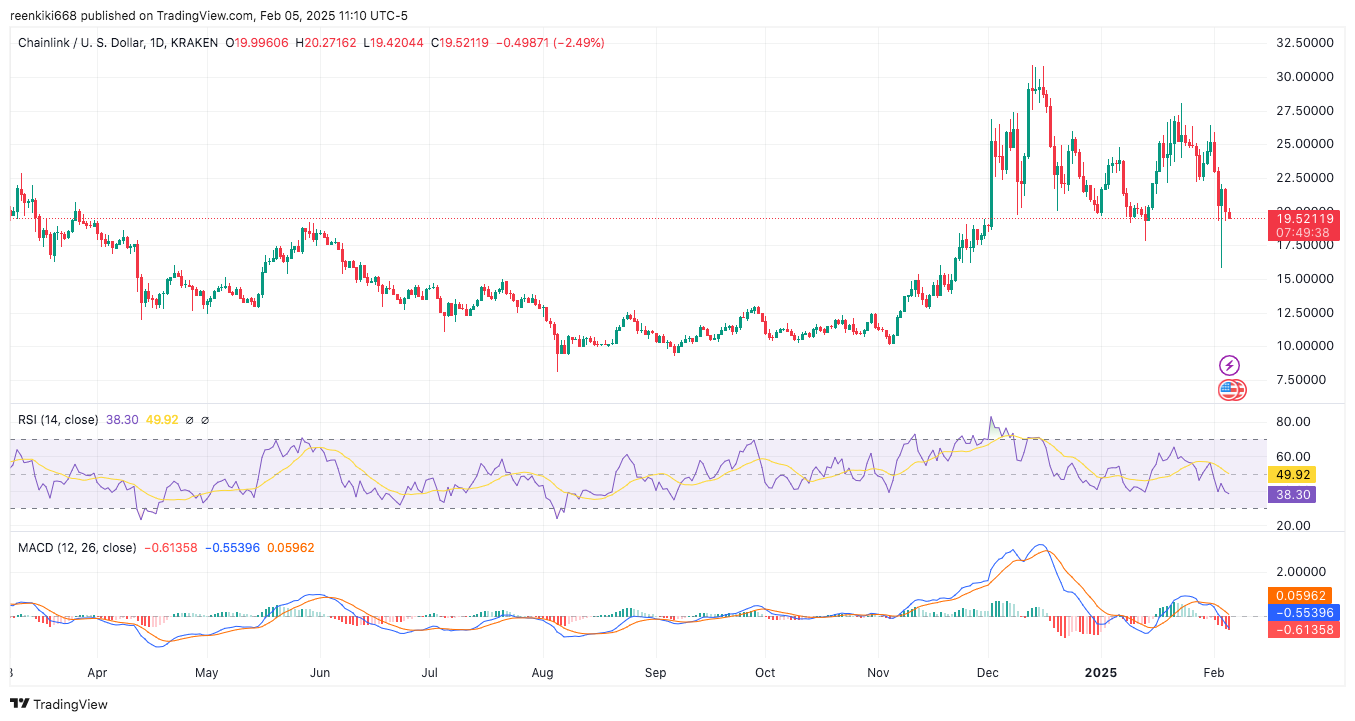
Technical indicators present mixed signals. The Relative Strength Index (RSI) sits at 38.30, nearing oversold territory. This suggests potential buying interest if LINK approaches critical support zones.
Meanwhile, the Moving Average Convergence Divergence (MACD) indicator shows the MACD line below the signal line, confirming bearish momentum. However, the histogram indicates decreasing selling pressure, hinting at a possible reversal.


