
- ADA nears key resistance at $0.80-$0.85; a break above $1 could confirm a bullish trend, while failure may lead to a drop to $0.60.
- The MACD and RSI indicate weakening bearish pressure, but ADA must reclaim $0.80 to sustain a reversal and test $0.90-$1.
- Historical trends suggest ADA could replicate a 2020-style rally, but a breakout above $1.30 is needed for a long term bullish cycle.
Cardano (ADA) has had notable fluctuations, showing signs of both recovery and resistance. Over the past 24 hours, ADA gained by 2.15%, while its weekly rise is at 2.93%. However, the monthly trend remains bearish, with an 18.02% decline. Despite this, ADA remains 40.99% higher since February 2024. At press time, on Feb 13th, ADA was trading at $0.7843, with a market capitalization of $27.65 billion.
Technical Indicators and Market Trends
The RSI is at 42.77, slightly below the neutral level of 50. Recently, the RSI dropped to 33.88, approaching the oversold zone, before recovering. This suggests weakening bearish momentum.
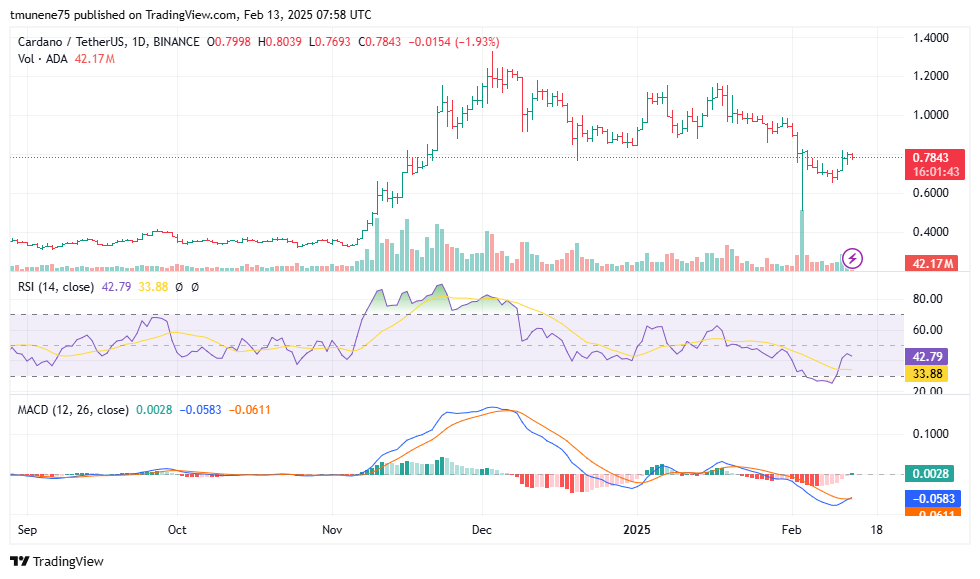
The MACD line is at 0.0028, just above the signal line at -0.0583. A narrowing histogram indicates diminishing bearish pressure, hinting at potential bullish movement. If the MACD line crosses above zero, a stronger upward trend may emerge.
Price movements show that ADA has solid support at $0.60 following a major decline. Resistance levels are at $0.80-$0.85, which ADA must surpass to reach $1. The price is gradually rebounding from recent selling pressure, increasing the likelihood of a short term reversal.
Support, Resistance, and Market Projections
The 50 day moving average Is at $0.735, while the 200 day moving average is at $0.808. In November 2024, a golden cross occurred.
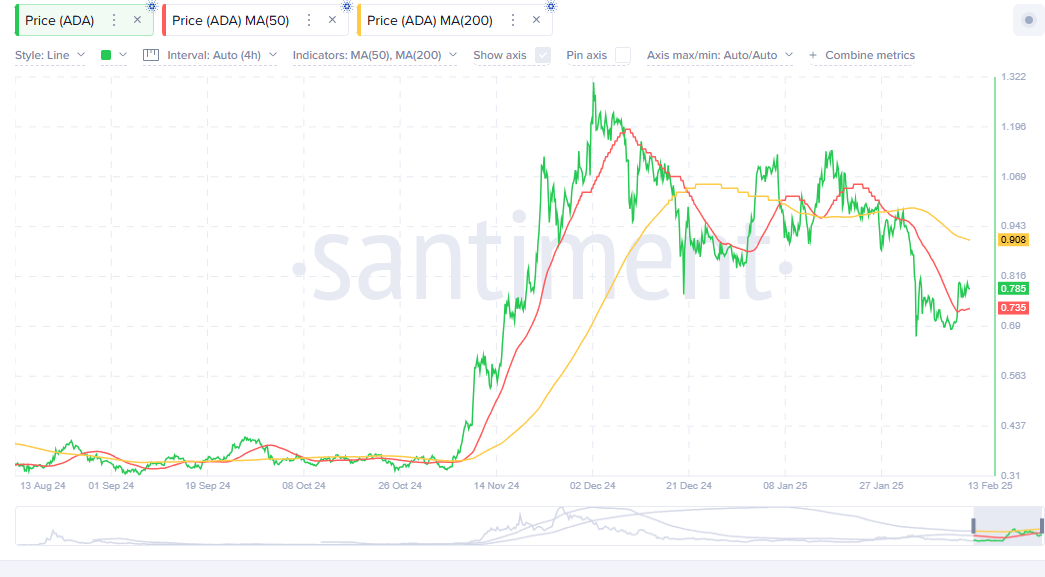
This happened when the MA50 surpassed the MA200, leading to a strong rally past $1.30. However, a death cross in January 2025, where the MA50 fell below the MA200, led to a bearish phase, bringing ADA below $0.75.
The MA50 is acting as the immediate support at $0.735, while the MA200 at $0.808 is the critical resistance level. If ADA reclaims $0.80, it could test $0.90-$1. However, failure to sustain above $0.735 may lead to a drop toward $0.65-$0.60.
Historical Patterns and Future Scenarios
According to analyst Ali, ADA’s current trend resembles its 2020-2021 price cycle but at a slower pace. Historical data shows that ADA surged from $0.10 to an all-time high of $3.04 within 287 days.
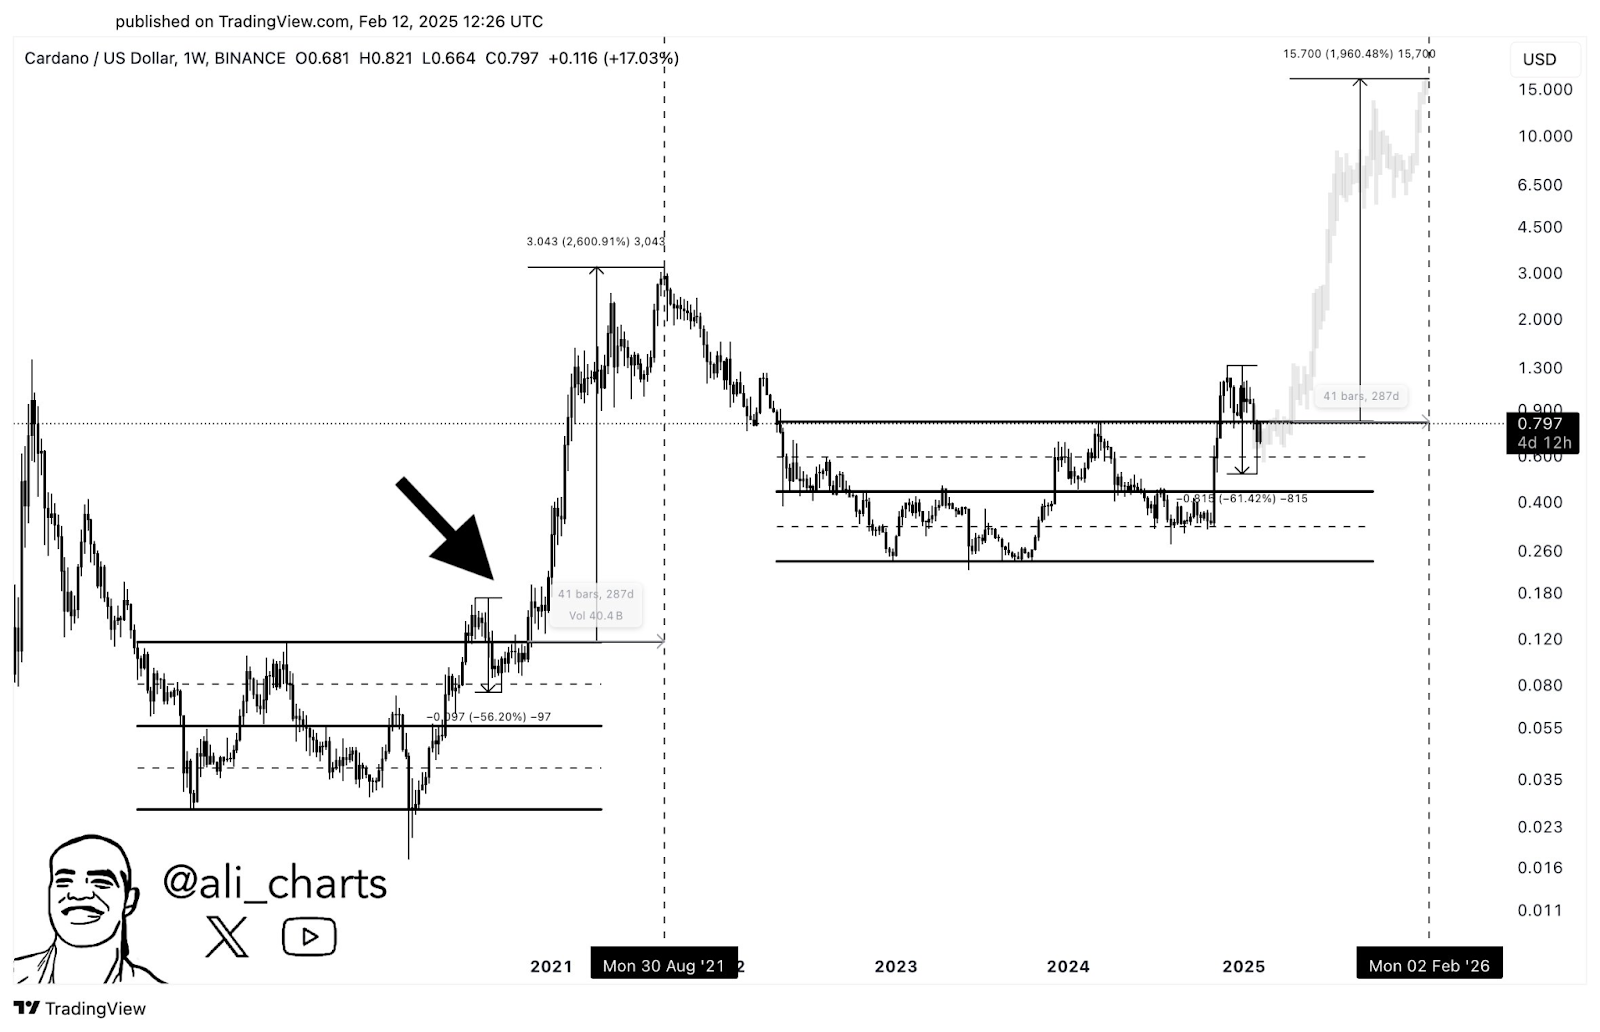
After the peak, it declined by over 85%, settling into a prolonged bear market.ADA has attempted to reclaim $1 but has retraced by 61.42% to $0.61 before rebounding. The key resistance is at $0.90-$1, while major long term support is between $0.26-$0.40.
If ADA follows its past trend, it may replicate its previous bull run, potentially reaching $15.70 in the long term. However, a sustained break above $1-$1.30 is necessary to confirm an uptrend.
In the short term, ADA must surpass $0.85-$0.90 to have a realistic chance of reaching $1.00 by February 14. Without a strong catalyst, this remains a low probability outlook.


