
- XRP remains in a consolidation phase, with critical support at $2.40 level.
- Spot inflows and outflows highlight volatility, impacting XRP’s price movements.
- Technical indicators show bearish momentum, but potential rebound signals.
XRP’s volatility remains below 2017 levels, indicating that its real breakout has yet to begin, according to analyst STEPH IS CRYPTO. The cryptocurrency has seen notable fluctuations in market activity, but its price remains above $2 despite recent corrections. XRP’s market performance reflects a mix of bullish and bearish indicators, shaping its potential trajectory in the coming months.
#XRP’s volatility index is far from 2017 levels.
— STEPH IS CRYPTO (@Steph_iscrypto) February 11, 2025
XRP’s real breakout hasn’t even begun. pic.twitter.com/yEY45gqQhB
XRP Market Performance and Price Trends
XRP is currently valued at $2.40, with a 24-hour trading volume of over $4.26 billion. This marks a 4.63% decline in the past 24 hours and a 3.73% drop over the last seven days.
The cryptocurrency’s circulating supply stands at 58 billion XRP, translating to a market capitalization of $138.64 billion. Although XRP has faced setbacks, its price movements suggest a consolidation phase that may determine its next direction.
Historical trends indicate that XRP experienced a strong rally in late 2024, surpassing the $3 mark before facing corrections. The price has since stabilized around $2.40, which serves as a critical level for traders. A descending pattern of lower highs and lows suggests a struggle to reclaim previous peaks, with market sentiment reflecting uncertainty.
Spot Inflows and Outflows Indicate Volatility
A closer look at XRP’s spot inflow and outflow chart reveals significant shifts in net flow. Initially, net outflows dominated, exceeding $100 million. However, by late November, inflows surpassed $200 million, aligning with a price surge.
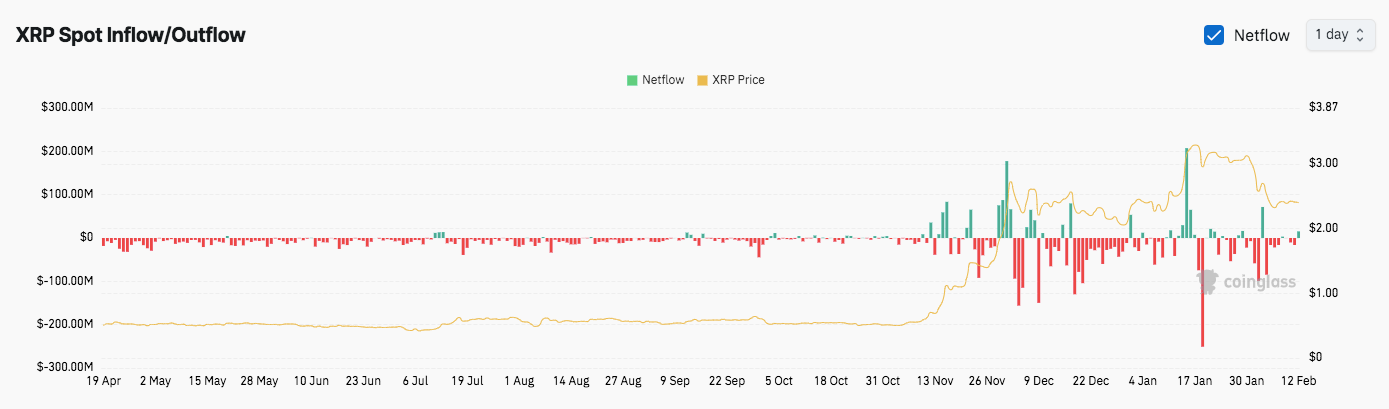
The most notable spike occurred in mid-January when inflows exceeded $300 million, pushing XRP toward its peak of $3.87. Despite this, subsequent sharp outflows, particularly in early February, led to a decline below $200 million in net outflows. While price fluctuations persist, XRP has maintained a level above $2.
Key Support and Resistance Levels
The $2.30 to $2.40 range currently acts as a critical support zone. Holding this level is essential to sustain bullish sentiment. Below this, the $2 mark serves as a psychological support level, potentially attracting strong buying interest. If selling pressure intensifies, XRP could revisit its previous breakout zone between $1.80 and $1.90.
On the resistance side, the $2.60 to $2.80 range presents the first major hurdle for XRP’s recovery. A breakout above this zone could signal renewed momentum, while $3 remains a key psychological resistance level. If bullish pressure strengthens further, XRP may target the $3.50 to $3.80 range in the near future.
Technical Indicators Reflect Market Sentiment
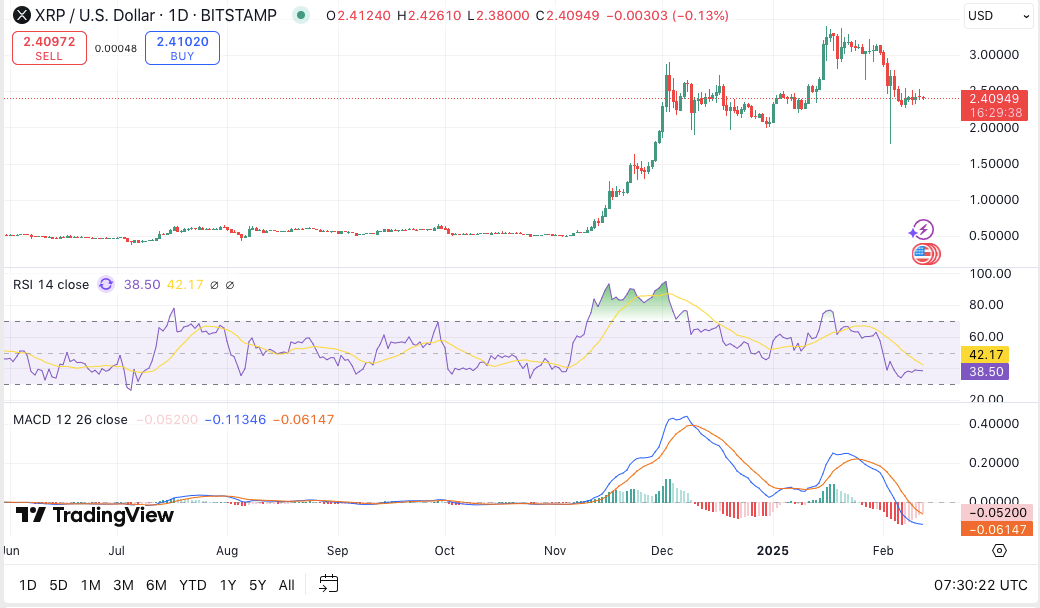
Technical indicators offer additional insight into XRP’s market dynamics. The Relative Strength Index (RSI) currently stands at 42.17, suggesting bearish momentum but indicating potential for a rebound. Meanwhile, the Moving Average Convergence Divergence (MACD) displays a bearish crossover, with negative histogram bars reflecting downward momentum.


