- ADA shows a 4.39% decline, indicating volatility after an initial upward trend.
- Key resistance at $1.16 and support at $1.05 may dictate ADA’s next move.
- RSI and MACD suggest neutral to weakening momentum for ADA in the short-term.
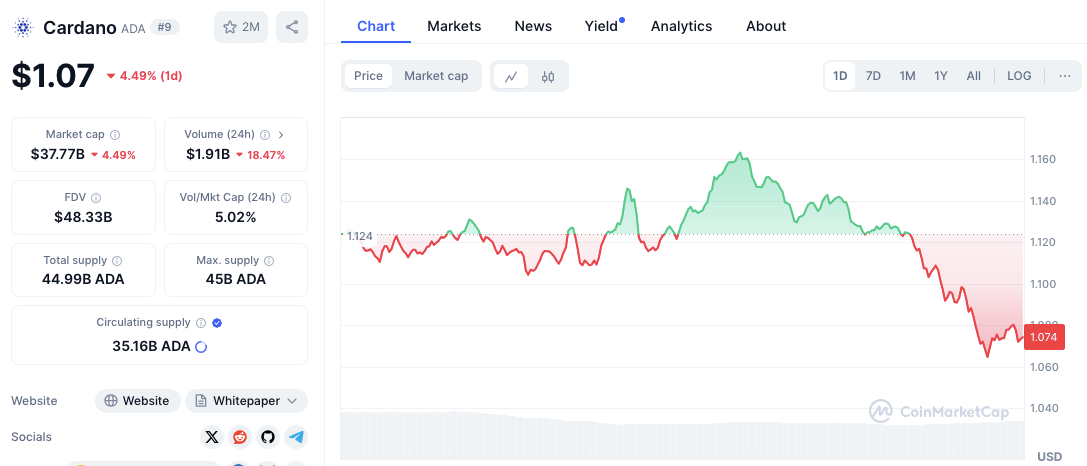
Cardano (ADA) has recently seen fluctuations in its price, sparking interest among traders and investors. As of January 18, the price stands at $1.07, marking a 4.39% drop in the past 24 hours. The price action has shown a sharp decline after an initial upward trend.
Price Action and Market Movement
ADA has experienced notable volatility over the past 24 hours. Initially, the price trended upwards, reaching a peak of $1.16 before reversing course. The current chart shows a consistent downtrend, with the price settling around $1.07.
This level represents a significant decline from the earlier peak, indicating a shift in market sentiment. If the downward trend persists, the next support levels will be crucial in determining whether the price can stabilize or continue to fall.
Key Support and Resistance Levels to Watch
ADA’s price action is currently influenced by key levels of support and resistance. On the upside, the $1.16 resistance level stands out. This level has previously caused the price to reverse, making it a critical point for potential upward momentum. A breakthrough above this level could open the door for a rally, but it would require strong buying pressure.
On the downside, the $1.05 support level is the immediate point of interest. This level aligns with the recent decline and is expected to act as the first line of defense for ADA. A further breakdown could bring the psychological $1.00 level into play. Historically, the $1.00 mark has acted as a strong support level, and its behavior in the coming days will be pivotal for the overall trend.
Indicators Highlight Mixed Sentiment
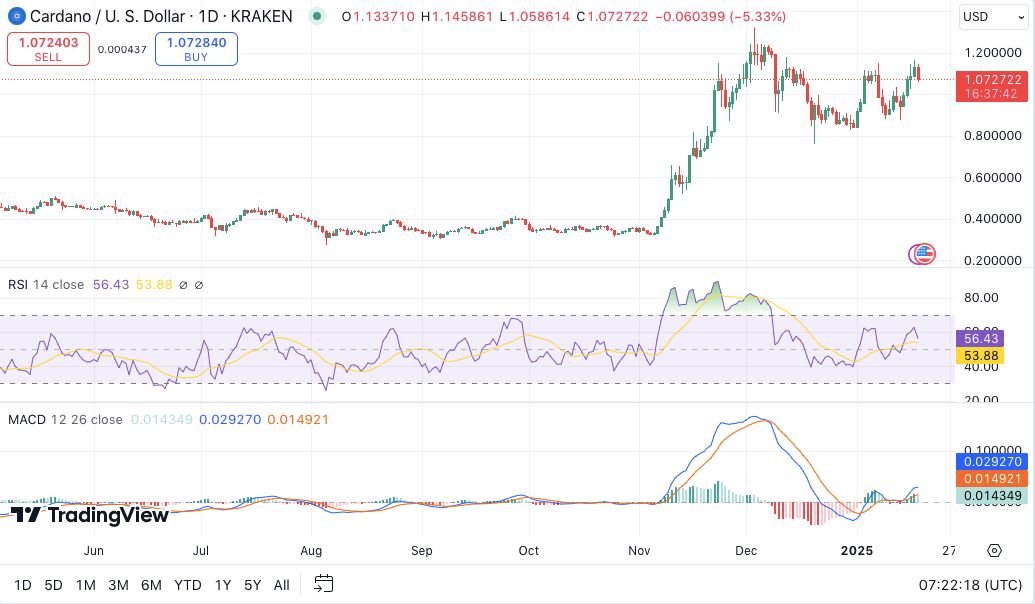
Several technical indicators are currently showing a mixed outlook for ADA. The RSI stands at 56.30, indicating a neutral market sentiment. This suggests that the market is neither overbought or oversold, pointing to a balanced outlook for the asset.
However, if the RSI moves above 60, it could signal increasing buying pressure. Conversely, a drop below 40 would indicate the potential for a bearish reversal.
Additionally, the MACD is currently above the signal line, signaling bullish momentum. However, the narrowing distance between the MACD and signal line suggests that this momentum may be weakening. If the MACD crosses below the signal line, it could point to a shift toward a bearish trend.


